Safer Bridges (a mid-year update)
By Deron T. McCoy, CFA®, CFP®, CAIA®
Chief Investment Officer
At the start of 2023, we opined that the main risk from last year (inflation) was in the rear-view mirror, but we also warned that new risks were on the horizon (recession). Five months later, has anything changed?
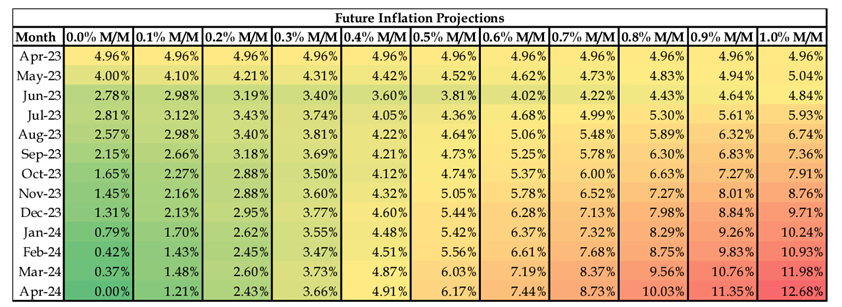
First, let’s analyze and update the risks around inflation. The December print (posted in early January) came in at 6.45% and the latest print (the April figure posted in early May) came in at 4.96%. While still higher than the Fed’s target rate, the path is clearly to the downside. And we believe this should continue. Why? It’s really just a product of simple math. The annual inflation number is an aggregate of the previous 12 Month-over-Month (M/M) prints. And since it was this time last year when inflation was running hot, over the next 60 days last year’s elevated M/M prints from May (0.92%) and June (1.19%) will be replaced with presumably lower numbers (the most recent M/M numbers have ranged between -0.03% and 0.52%).
Although we’re used to seeing an annual number for CPI, think of the M/M number as 1/12 of the annual figure (an M/M of 0.5% would translate to roughly a 6% annual CPI). Even if we add two more M/M prints of 0.5% in May and June, the annual inflation number will fall into the 3s by summer. Sure, inflation might certainly trend higher next year. But that’s not a risk we need to worry about right now—so let’s enjoy a little good news as inflation continues to be in the rear-view mirror.
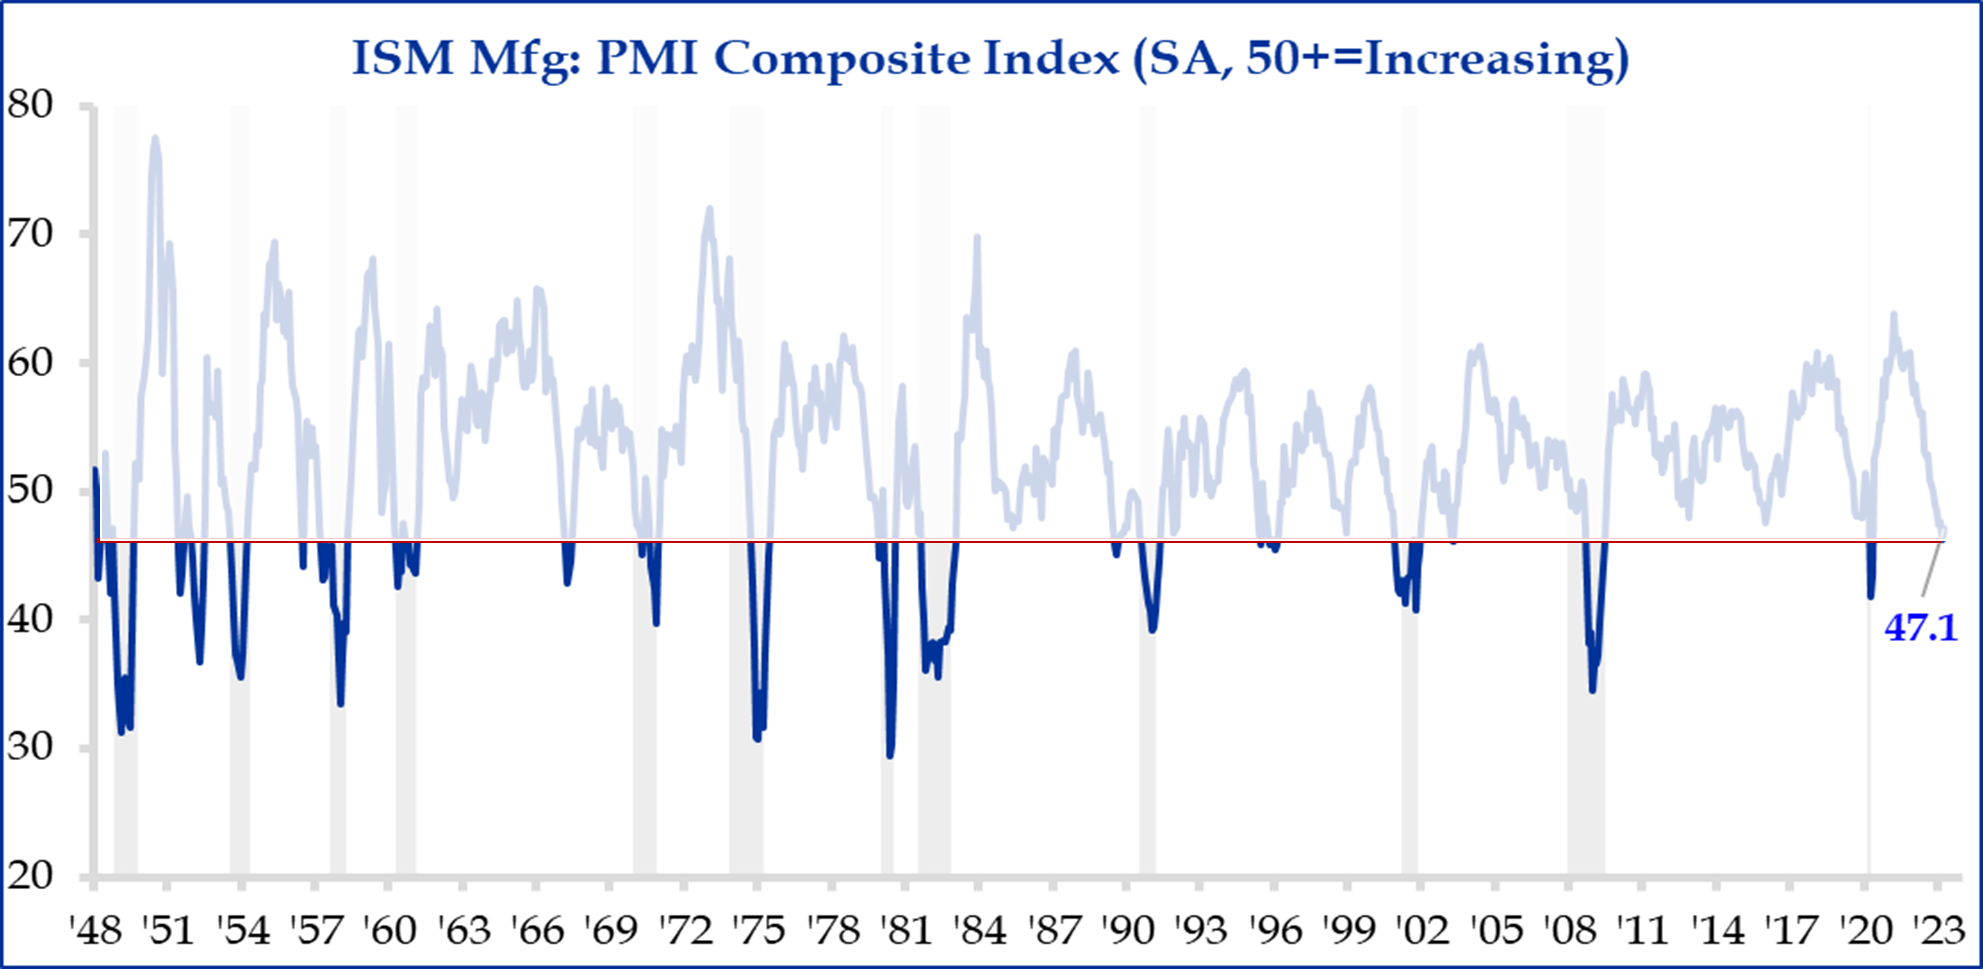
Second, what about growth and recession fears? Unfortunately, our concerns from January are starting to crystallize—as growth continues to slow and cracks in the economy slowly emerge. Many economic data points (e.g., Durable Goods, Factory Orders, Residential Construction, Exports, Imports, etc.) are all deteriorating alongside the ISM Manufacturing Index—which hovers near levels of past recessions (denoted by a gray bar column) with a 75% hit rate.
While it’s true that 25% of the time the economy manages to avoid recession and instead muddles through with a somewhat ‘soft landing.’ But what else has happened recently? No, not the debt ceiling (we’ll get to that in a moment). The Banks! Investors simply can’t ignore the current stress on the banking sector—with multiple bank failures over the last couple of months.
What happens in the financial sector during times of stress? Banks naturally pull in the reins to become less aggressive—in other words, they tighten their lending standards. Not surprisingly, recent data is clearly indicating that credit is becoming harder to come by. Consider the below chart in which we overlay Bank Lending onto the aforementioned manufacturing index (we also added green bars to denote the soft patches in manufacturing without a recession).
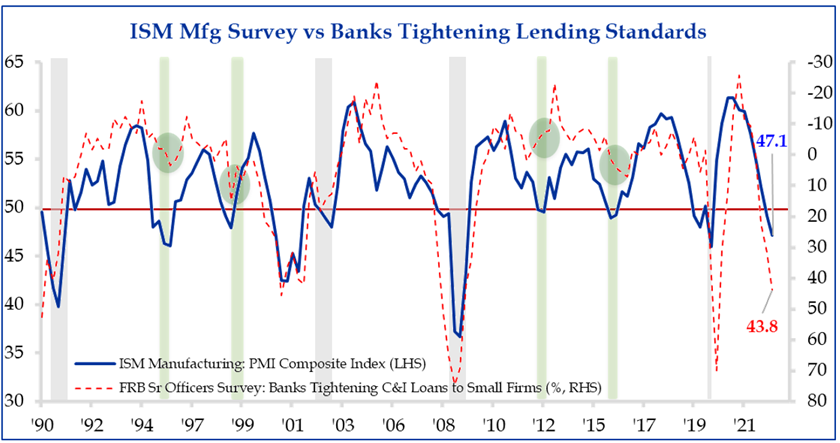
Notice the current move in bank lending with a growing number of banks tightening loans to small businesses. Now, look closely at where bank lending was during those previous soft landings. Taken together, the current economic weakness coupled with recent events at regional banks doesn’t paint a rosy picture.
It’s not solely that banks are tightening lending standards. As the below graph clearly depicts, loan demand has dramatically softened as well. All of which points to weaker growth in the quarters ahead.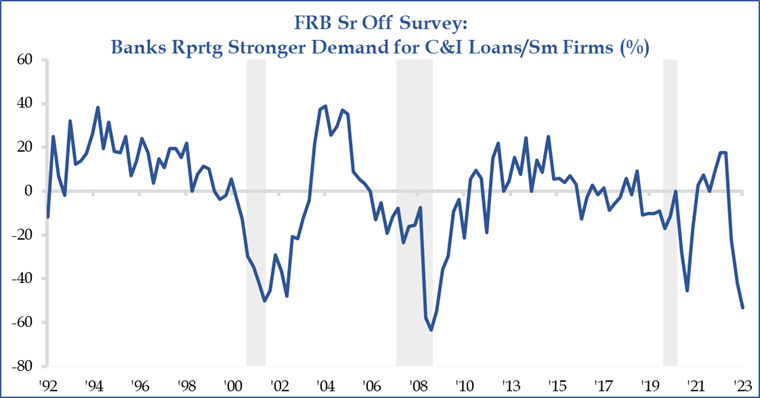
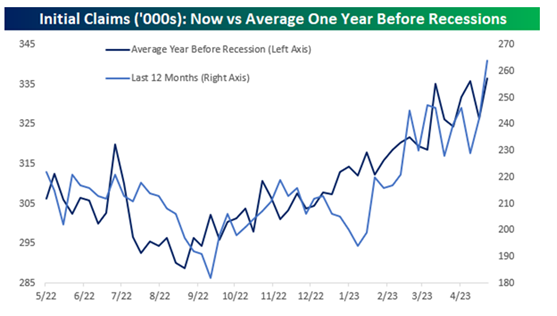
The one bright spot in all this has been a surprisingly strong consumer driven by a resilient jobs market. But alas, this too appears to be in the early innings of showing weakness.
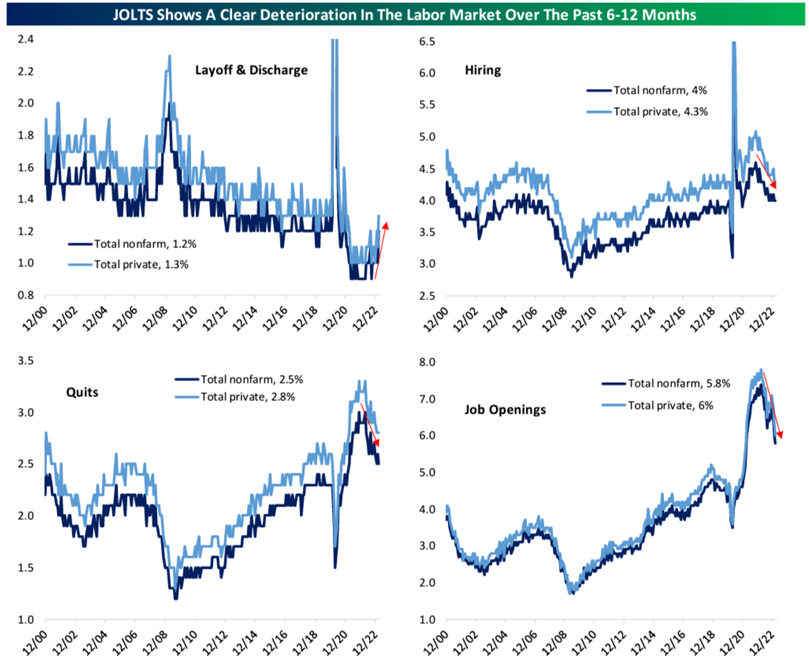
We can analyze the current trajectory of various labor market metrics compared to those of previous recessions (see adjacent charts), and the warning signals are clearly flashing —perhaps they’re not yet a bright red, but they’re certainly a cautionary yellow.
What else has changed as we approach the midpoint of the year? Oh yeah, Washington DC. Investors the world over are grappling with how best to approach the debt ceiling showdown. Perhaps this is more a political discussion than a portfolio discussion. But no matter—it’s top-of-mind for many investors, so we will do our best to outline what may unfold. Hopefully, it will all be old news by the time you read this update. According to Strategas Research Partners, “the threat of an actual default of the U.S. debt is an extremely low probability. Policymakers often talk about default on the US debt during debt ceiling debates. We want to be clear that this is a political argument designed to pressure the other side into moving forward on the debt ceiling and/or their preferred attached policies. In reality, the U.S. government has more than enough cash to flow to pay interest even if the ‘default date’ is reached. We believe that Treasury will have no other option but to make those payments based on current law, and their previous plans, which were outlined in a Fed conference call in 2013, when we were close to the X date. Treasury said that principal and interest payments on Treasuries would continue to be made on time, as maturing securities would be rolled over into new securities and interest would be paid out of the Treasury General Account, and then a daily decision would need to be made on what other spending to prioritize. Should Congress fail to raise the debt ceiling, the government would have enough money for Social Security, Medicare, Defense, and interest. Other government spending would come to a halt, which is akin to a government shutdown. In this current cycle, the prioritization of government spending would be short lived, as the Treasury expects new tax revenue on June 15th and new extraordinary item cash on June 30th, which can cover through the end of July. As such, we see little chance of default even if Congress does not act. But we do believe Congress will act before June 1st, making these mechanics less relevant.”
Even if a debt ceiling is reached, however, it may not serve as the ‘all clear’ signal that investors desperately want. In 2011, the bulk of the drop in stocks occurred after the deal was reached. Why? Well, the austerity that came with the deal was much greater than expected and economic growth expectations fell.
Summary
While there seems to be a dearth of positive tailwinds out there, thankfully, there are at least a few nuggets of good news to be found!
Investors will be well served to remember that the economy is NOT the stock market. Instead of responding to recessions, stocks tend to predict them. Therefore, any market damage typically occurs before the storm rather than during it. U.S. stocks may continue to chop around (as we first highlighted this time two years ago), but unlike earlier cycles, this current investment landscape is presenting many opportunities that failed to materialize during the last cycle. Both fixed income and overseas equities (many international indices are at all-time highs!) seem to be a prudent allocation for a portion of your portfolio. Consider them to be ‘safer bridges’ that can help investors navigate their way across the economic valley that may lie ahead.
As always, we encourage you to reach out to your SEIA advisor to discuss your current portfolio allocation and explore potential adjustments that may be beneficial given your particular situation and circumstances.
The information contained herein is for informational purposes only and should not be considered investment advice or a recommendation to buy, hold, or sell any types of securities. Financial markets are volatile and all types of investment vehicles, including “low-risk” strategies, involve investment risk, including the potential loss of principal. Past performance does not guarantee future results. For details on the professional designations displayed herein, including descriptions, minimum requirements, and ongoing education requirements, please visit seia.com/disclosures. Signature Estate & Investment Advisors, LLC (SEIA) is an SEC-registered investment adviser; however, such registration does not imply a certain level of skill or training and no inference to the contrary should be made. Securities offered through Royal Alliance Associates, Inc. member FINRA/SIPC. Investment advisory services offered through SEIA, 2121 Avenue of the Stars, Suite 1600, Los Angeles, CA 90067, (310) 712-2323. Royal Alliance Associates, Inc. is separately owned and other entities and/or marketing names, products, or services referenced here are independent of Royal Alliance Associates, Inc.
Third Party Site
The information being provided is strictly as a courtesy. When you link to any of the websites provided here, you are leaving this website. We make no representation as to the completeness or accuracy of information provided at these websites. Nor is the company liable for any direct or indirect technical or system issues or any consequences arising out of your access to or your use of third-party technologies, websites, information and programs made available through this website. When you access one of these websites, you are leaving our web site and assume total responsibility and risk for your use of the websites you are linking to.
Dated Material
Dated material presented here is available for historical and archival purposes only and does not represent the current market environment. Dated material should not be used to make investment decisions or be construed directly or indirectly, as an offer to buy or sell any securities mentioned. Past performance cannot guarantee future results.