The Winter Whipsaw
Updated as of 2/8/2018
WHAT HAPPENED.
After one of the better Januarys on record, February is experiencing one of its worst starts ever. On the 5th, the Dow Jones dropped 1175, the worst point-drop EVER. The S&P 500® dropped a whopping 113 points, hitting a low of 2638 at one point intraday. The selloff continued on February 8th, as the Dow Jones and S&P 500 fell 1032.89 and 100.66 points respectively. While the numbers are large – especially thinking back to when the entire S&P 500 index dipped below 700 during the depths of the financial crisis – the markets are much higher now, so investors (and the media) should really focus on the percentage drop. While large (Dow Jones -4.6%), the market’s drop on February 5th was in fact only the 108th worst percentage drop in history1. After that great January, the Dow Jones index is now in the red for the year, bringing the correction tally to roughly -10.36% from the high reached on January 26th. Talk about a whipsaw!
IS THIS NORMAL?
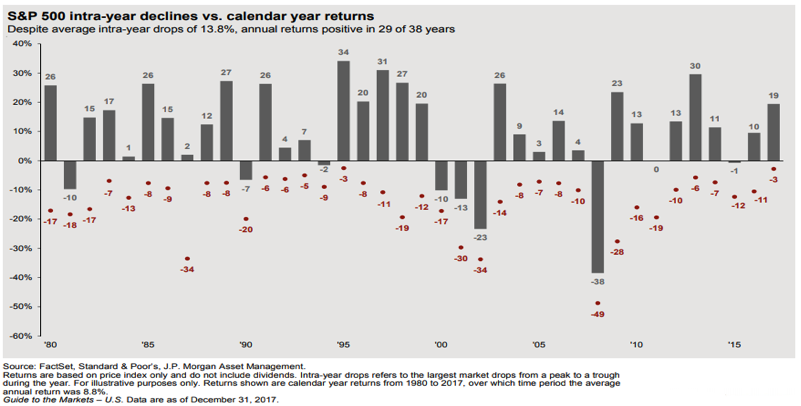
As we highlighted in last quarter’s Insights, last year was far from normal with the stock market posting positive returns every single month. And January was even crazier with seemingly positive returns nearly every day! We urged investors to prepare for higher volatility by rebalancing and taking profits. Now that the selloff has started, however, it is important to place current events in historical context. Market corrections are not only normal but healthy – removing a level of froth that could cause a bubble. Since 1980, the average S&P 500 annual peak-to-trough decline has been around 13.8% but that includes recessionary years2. Even in the last 5 years of this bull market, selloffs have averaged 7.8% per year – while markets continued marching to all-time highs2. The current 10% selloff, therefore, is not only close to average but should be expected.
So is this a normal correction or something more sinister? We can’t use the 2011 or 2016 selloffs as a guide since the current investment landscape is the polar opposite to those conditions; where fears were centered on economic weakness, valuations were much lower, and the Fed was an investor’s friend with Quantitative Easing and loose monetary policy serving as the law of the land. Today, both the fears and the landscape are much different.
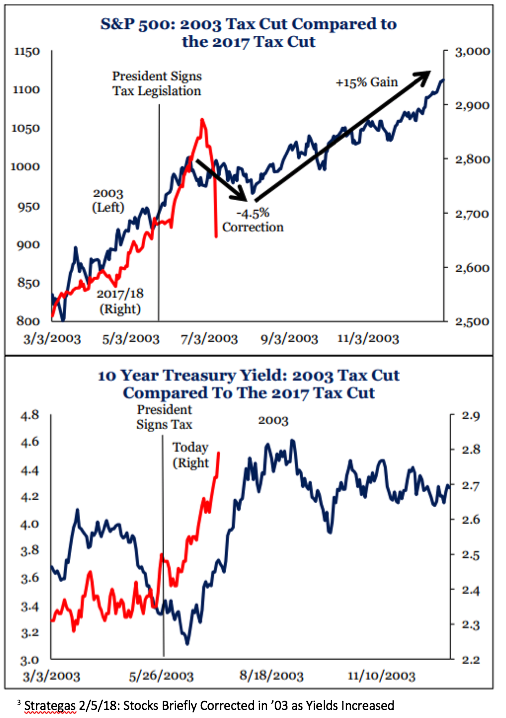
A worthy comparison might be 2003, when we went through a similar eight-week adjustment after Congress passed the previous major tax cut package. In the immediate aftermath, yields rose around 100 basis points and stocks sold off 4.5%3. In this environment, rising bond yields are actually a good thing as they signal that the business cycle is normalizing and growing up. But as any parent can attest, growing up typically comes with occasional tantrums—precisely what investors are witnessing this month. Most importantly is that over the balance of 2003, yields stabilized, and equity markets not only rebounded but marched higher by 15%—hopefully a nice guide to the rest of 20183.
WHY DID IT HAPPEN?
Last Friday, a single economic data point (wage growth) suggested that rapid inflation was heading our way. The stock market then extrapolated that single data point to the rest of the economic cycle. Let us try to explain. While good for U.S. workers, economic theory holds that rising wages trigger inflation, as more money in the system chases the same amount of goods (Demand > Supply = Rising Prices = Inflation). Higher inflation, in turn, leads to a more aggressive Fed as they raise short-term rates to try and cool a hot economy. That scenario is dire, and further fueled by the recent tax cut stimulus. While tax cuts are again good for taxpayers, adding stimulus to an economy already at full employment risks overheating the economy.
Bull markets don’t die of old age – they die from policy mistakes, and overheating an economy certainly qualifies as a policy mistake. It creates even more inflation in the face of a dual-headwind: Quantitative Tightening (the Fed buying fewer Treasuries = less Demand) and a deficit financed tax cut (more borrowing to finance the higher deficit = more Supply). Decreasing demand in the face of higher supply equates to lower prices, higher yields and materially higher interest rates conspiring to potentially invert the yield curve and tip us into recession. Ouch!
But this is important, the stock market has incorrectly predicted 12 of the last 3 recessions. It is simply too early (especially after one data point) to suggest that we have a regime change and recession is imminent. In fact, we believe the opposite might be true. After years of tepid growth, we finally have a robust economic cycle. GDP growth may top 3% or even 4% this quarter, as U.S. production gains steam. According to Strategas Research Partners, the “manufacturing sector is on a roll as it sees rapid growth in orders, outputs, and employment which we see as continuing well into 2H 2018” and “corporate earnings are at their highest year-over-year growth since 2012.” Furthermore, the second year of global synchronized growth continues as economic surveys are “collectively enjoying an extraordinary expansion as all 18 advanced for a third consecutive month. By any standard, the surveys indicate more fast-paced global growth in 2018.” While it is true that Capital Markets lead fundamentals, it should be noted that credit spreads have widened but they aren’t blowing out as the stock market would suggest. The selloff just doesn’t appear to be about growth.
ARE WE AT THE BOTTOM?
If the selloff isn’t about growth, then it likely won’t turn into a sustained bear market. Thus, the end may be near. Many signs yesterday pointed to a climactic purge that usually marks the end of the selloff and suggests that we’re closer to the end than the beginning in terms of magnitude. However, the duration of the selloff (compressed into 6 trading days rather than the usual 6 weeks that most investors are accustomed to) is startling. But in the heyday of passive investing and easy-to-trade ETFs from one’s mobile phone, the timetable for investor reaction also seems to have shortened.
We expect 2018 to remain volatile as headline risk continues (e.g., the Debt Ceiling, Mueller/Russia, potential Trade and Currency Wars as well as Midterm elections). But it’s by no means all bad news. The tailwinds of economic growth, tax cuts hitting paychecks this month, and increased corporate buybacks should help to limit losses. And the best news is that stocks are now cheaper. After rebalancing and taking profits in January, it appears that February may be the time to go shopping.
1 Forbes: Here’s The Timeless Lesson You Can Learn From Yesterday’s Market Panic Attack
2 J.P. Morgan Guide to the Markets 1Q 2018
Investment decisions should be made based on the client’s specific financial needs, objectives, goals, time horizon and risk tolerance. Opinions expressed in this newsletter are not intended as and should not be used as investment advice or a recommendation of any security, strategy or investment product. The information and descriptions contained in this newsletter are not intended to be complete descriptions of all events and are provided solely for informational purposes. Due to real-time market movement and delayed timing resulting from delivery to you of the information herein, investment details may change after the publication of this report. SEIA and SIA have obtained the information provided herein from third party sources believed to be reliable, but no representation is made as to their completeness or accuracy. The information contained herein is the opinion of SEIA and SIA and is subject to change at any time. Indices are unmanaged and cannot be invested directly. Past performance does not guarantee future results. Investing involves risk and possible loss of principal capital. The financial markets are volatile and there are risks in all types of investment vehicles, including “low-risk” strategies. You should consult with appropriate counsel or other advisors on all matters pertaining to legal, tax, or accounting obligations and requirements. Registered Representative/Securities offered through Signator Investors, Inc., Member FINRA, SIPC, 2121 Avenue of the Stars, Suite 1600, Los Angeles, CA 90067. SEIA, LLC and its investment advisory services are offered independent of Signator Investors, Inc., and any subsidiaries or affiliates.
Third Party Site
The information being provided is strictly as a courtesy. When you link to any of the websites provided here, you are leaving this website. We make no representation as to the completeness or accuracy of information provided at these websites. Nor is the company liable for any direct or indirect technical or system issues or any consequences arising out of your access to or your use of third-party technologies, websites, information and programs made available through this website. When you access one of these websites, you are leaving our web site and assume total responsibility and risk for your use of the websites you are linking to.
Dated Material
Dated material presented here is available for historical and archival purposes only and does not represent the current market environment. Dated material should not be used to make investment decisions or be construed directly or indirectly, as an offer to buy or sell any securities mentioned. Past performance cannot guarantee future results.