2022 Q2 Tailwinds: Inflation, Recessions, and the Yield Curve.
By Deron T. McCoy, CFA®, CFP®, CAIA®
Chief Investment Officer
Welcome to 2022! After a 1-in-100-year pandemic, the joy of a potentially COVID-free world was quickly extinguished by the first ground war in Eastern Europe in over 75 years. Meanwhile, in the latter stages of this quarter, inflation reached a 40-year high. If investors were hoping that this year would mark a return to normalcy, thus far they’ve certainly been frustrated.
Yet despite the unprecedented ‘newsworthiness’ of Q1, most of the investment trends we’ve recently witnessed actually took root in Q4 of last year. In December, the Federal Reserve was finally forced to confront the inflation problem by promising to end monetary stimulus and raise short-term interest rates sooner than expected. Jerome Powell then continued the rhetoric, becoming even more ‘hawkish’ to start off the new year. The ‘high inflation / higher interest rates’ dynamic induced stocks to selloff through the first half of the quarter—moving the market into correction mode (down nearly -12% to a low of 4225 on the S&P 500®) on the eve of the Russian invasion.
Although incredibly scary and tragic on a human level, the enormity of the Russian/Ukraine war has thus far not impacted the U.S. stock market in any meaningful way. The pre-invasion market low was eclipsed on just four subsequent trading days—with the markets trading materially higher just three weeks later. With good reason, the primary focus has been squarely on Russia this quarter. However, it’s important to recognize that the bulk of Q1 losses occurred pre-invasion. So with that in mind, it appears that investors should put inflation front and center on their list of material risks.
How did we get here?
But how did we get here in the first place? In one word—COVID. The pandemic’s many tentacles have had severe ramifications:
- The actions and emergency stimulus measures that came out of Washington were nothing short of historic; dwarfing any prior government response to earlier crises and recessions. ‘Throwing money at the problem’ certainly helped to alleviate some of the pain amid a global lockdown, but the scope of government actions may have been orders of magnitude too large—creating excess Demand in an economy that wasn’t ready for it. If every action has an equal and opposite reaction, then the inevitable reaction to increased demand will be increased prices and inflation.
- After being cooped up for a year, society now wants to get out to spend, spend, spend and have some fun! Essentially, we’re squeezing two years of demand into a short window—again huge demand pushing prices higher.
- But with COVID, it’s not just a demand issue. The supply side is also broken. Why? Sick or quarantined employees are an unavoidable byproduct of a global pandemic. As a result, companies struggle to either make or ship their widgets; resulting in a broken supply chain and reduced supply of goods. What is the reaction to decreased supply? Increased prices and inflation.
- Furthermore, if the government is going to provide stimulus and free cash, many people opt to quit working or retire altogether. This, in turn, further reduces the supply of labor and crimps the supply chain resulting in, you guessed it, inflation.
- Finally, while the U.S. has moved past the Omicron spike, China and other east Asian countries are living through a horrific spike. So much so that entire cities, factories, and ports are once again shut down—further negatively affecting trade and the supply chain.
But none of this is ‘new news.’ Investors were dealing with the same issues last year, which is why we highlighted the risk of the economy being potentially overcaffeinated and overstimulated, leading to a choppy back half of 2021.
Where are we headed?
Why highlight inflation now in Q2? Yes, it was high and already accelerating before February 24th. But the invasion may have made the issue measurably more challenging. Besides the dreadful loss of life, the invasion has produced a resulting commodity shock in both energy and agriculture:
- Sanctions against Russia have wreaked havoc on global energy markets, with Crude Oil and Natural Gas moving markedly higher. Higher energy costs raise the cost of doing business, thus either earnings move lower or (more likely) prices move higher—fueling additional inflation.
- Not only do these higher energy costs impact fertilizer prices (a key input into agricultural commodity prices) but on the ground, the actual spring planting season in the ‘breadbasket of Europe’ has also been materially affected. And lower food supplies equate to more inflation.
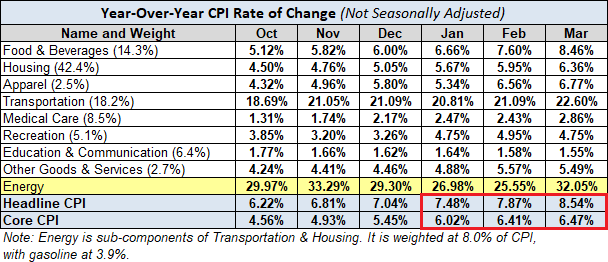
Source: Advisor Perspectives
This one-two punch of a pandemic and now a military conflict will likely push prices even higher in the coming months. But this is not unprecedented. In fact, higher prices have historically been intertwined with both pandemics and global conflicts. Consider that the current level of inflation has only been reached in a handful of eras including:
- 1916-1920 (WWI, Spanish Flu. Recession);
- The bulk of 1941-48 (WWII, Recession);
- A brief stint in 1951 (Korean War);
- 1973-75 (Vietnam War, Oil Embargo, Recession); and
- 1978-82 (Iran Hostage Crisis, Recession).
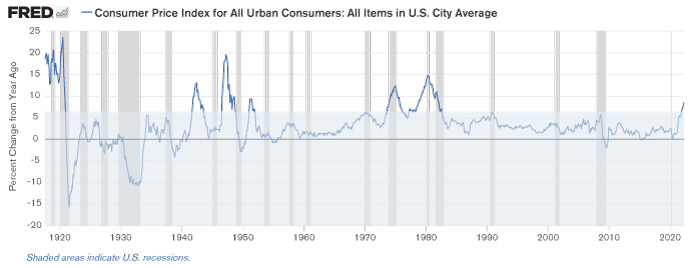
Source: US Bureau of Labor Statistics
Recessionary Fears
The episode in 1951 stands out for a couple of reasons—not only was it the shortest time period (the others lasted multiple years if not longer), but it was also the only period that didn’t involve an accompanying recession. So, will the next few years resemble 1951 or are we headed to recession? And why do higher prices at your local grocery store affect economies and global capital markets in the first place? Because inflation drives monetary policy, which in turn drives interest rates, which then drives the business cycle, which drives corporate earnings, and which ultimately drives the prices of stocks. It’s this attention to the business cycle that took center stage in the waning days of Q1.
By late March, investors’ attention had shifted to the inverted yield curve (where short-term interest rates rose higher than long-term rates), with everyone opining on whether it served as a harbinger of a looming recession. While the idea of another recession so soon after the last one seems implausible, we must respect history. In short, an inverted yield curve has been a great leading indicator of future economic weakness. So, while we’re not ruling out a future recession, we believe an immediate call now may be premature. Why? Well long-time readers will recognize one of our investment premises is a demand for ‘persistent and pervasive trends’ in the underlying data. The inverted yield curve which occurred in the last week of March failed both tests meaningfully. Not persistent. And definitely not pervasive. Consider the following:
- Persistent: The 2-year and 10-year yields (2s-10s) were inverted for less than 1 minute on March 29th (according to Fundstrat) and again for a brief time on March 31st. While this could change in the weeks and months ahead (and possibly by the time you read this), at the time of this writing, it’s simply far too soon to make a recession call.
- Pervasive: The yield curve is normally upward sloping. When inverted, it’s normally downward sloping. But right now, it looks more like a piece of bacon waving up and down. Or in other words, the curve is inverted but not in its entirety—less than 20% of the curve is actually inverted.
If you’re confused, you are not alone. Let’s dive deeper. You will note that the term ‘interest rates’ is plural. It’s not singular. There isn’t just one interest rate. Instead, there many interest rates depending on the length of borrowing (including the 3-month rate, the 1 year, 10-years, 30-year and most everything in between). In late March, only a handful of these data points were inverted. Bespoke Investment Group adds that “Investors are rightfully concerned that inversions raise the probability of a recession, but recession alarm bells shouldn’t really start ringing when just one part of the yield curve inverts. Instead, the odds of a recession rise as an increasing number of points in the yield curve invert. For instance, while 2s-10s is flirting with inversion, the three-month vs 10-year curve is nowhere even close to inverted and was just recently at its steepest level in five years. Historically speaking, when just a few points of the yield curve invert, the probability of a recession barely increases. It isn’t until the majority of points in the curve invert that a recession in the next two years becomes increasingly inevitable.”
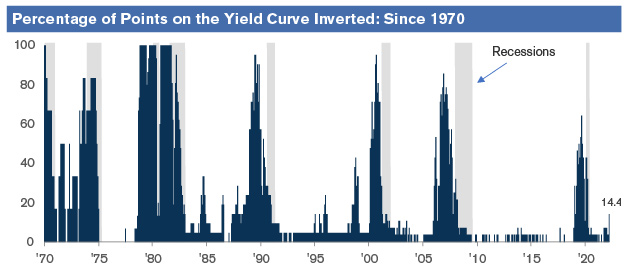
Source: Bespoke Investment Group
The takeaway? It’s too soon to make a recession call, but we remain on high alert. The landscape is a veritable mixed bag, as the Federal Reserve is poised to raise interest rates until something breaks—either the intended (and mandated) target of inflation, or the unintended (and definitely not mandated) target of economic growth, which may falter due to the weight of higher interest rates. Certainly, the path of future inflation and monetary policy will remain top of mind here in Q2 and beyond.
The information contained herein is for informational purposes only and should not be considered investment advice or a recommendation to buy, hold, or sell any types of securities. Financial markets are volatile and all types of investment vehicles, including “low-risk” strategies, involve investment risk, including the potential loss of principal. Past performance does not guarantee future results. For details on the professional designations displayed herein, including descriptions, minimum requirements, and ongoing education requirements, please visit seia.com/disclosures. Signature Estate & Investment Advisors, LLC (SEIA) is an SEC-registered investment adviser; however, such registration does not imply a certain level of skill or training and no inference to the contrary should be made. Securities offered through Royal Alliance Associates, Inc. member FINRA/SIPC. Investment advisory services offered through SEIA, 2121 Avenue of the Stars, Suite 1600, Los Angeles, CA 90067, (310) 712-2323. Royal Alliance Associates, Inc. is separately owned and other entities and/or marketing names, products, or services referenced here are independent of Royal Alliance Associates, Inc.
Third Party Site
The information being provided is strictly as a courtesy. When you link to any of the websites provided here, you are leaving this website. We make no representation as to the completeness or accuracy of information provided at these websites. Nor is the company liable for any direct or indirect technical or system issues or any consequences arising out of your access to or your use of third-party technologies, websites, information and programs made available through this website. When you access one of these websites, you are leaving our web site and assume total responsibility and risk for your use of the websites you are linking to.
Dated Material
Dated material presented here is available for historical and archival purposes only and does not represent the current market environment. Dated material should not be used to make investment decisions or be construed directly or indirectly, as an offer to buy or sell any securities mentioned. Past performance cannot guarantee future results.