Are We There Yet? Part I
By Deron T. McCoy, CFA®, CFP®, CAIA®
Chief Investment Officer
Inflation changes everything—and it finally happened. We’re now officially in a bear market, with some market experts calling for recession. Welcome to 2022! But wise investors would be well served to remember that stocks predict; they look ahead. So, while a recession may indeed be in our future, the recent stock decline may have already priced it in. How do we tell? No one can be 100% certain. We can, however, analyze several indicators to glean a sense of where we stand relative to history.
AVERAGE STOCK PERCENTAGE DECLINE
It was mid-December when we first suggested that ‘buying the dip’ was premature. Our thinking centered on the fact that after a historic run-up, perhaps any selloff should at least get to some level relevant to recent history. One way to measure, map, and compare the current selloff with prior downturns is to look at the percentage decline of the average S&P 500® stock and compare it with a 2-standard deviation type of an event (see figure 1). Although the late-2021 decline met the ‘median’ threshold, it never came close to a more appropriate historic selloff— suggesting there was further downside to come.
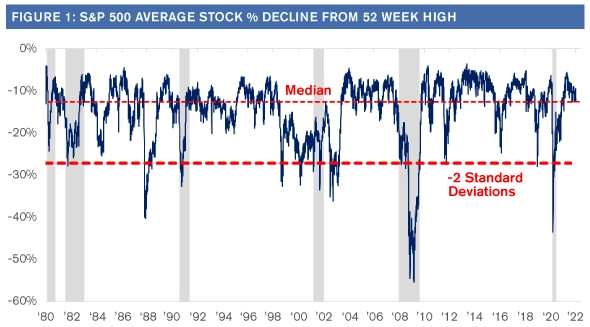
Source: Strategas Research Partners, June 2022
But now, six months later (after officially entering a bear market last week), if we revisit the theme, we discover there’s a bit of good news! The bear market has effectively pushed the S&P 500 down to a 2-standard deviation type level (see figure 2). In other words, if we use history as our guide, the current selloff may now be approaching a bottom.
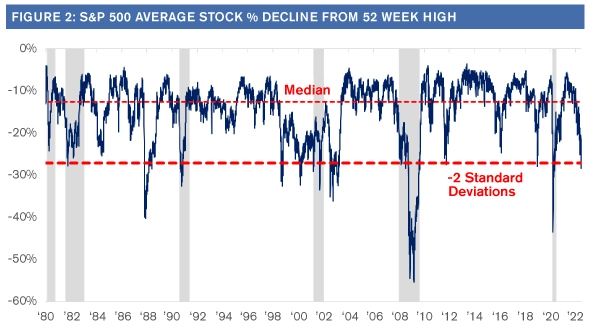
Source: Strategas Research Partners, June 2022
PERCENT OF STOCKS THAT ARE IN DECLINE
Long-time readers will recognize the fact that we prefer to see pervasive and persistent data across a variety of metrics. One of these data points can be gleaned from comparing and contrasting the percentage or number of stocks advancing in a given market with those that are declining (i.e., the Advance/Decline Ratio).
According to Bespoke Investment Group, over four consecutive trading days in mid-June, the net advance/decline (A/D) reading for the S&P 500 registered -400 or lower—meaning that during each of those trading days there were more than 400 stocks (out of 500) that traded lower. By itself, that doesn’t mean much until you place it in historical context. Since 1990, there has never been a streak of similar duration. Wow!
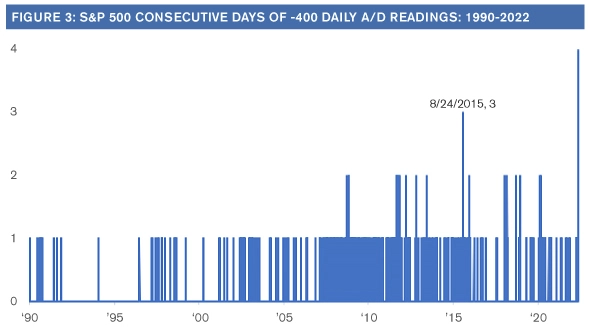
Source: Bespoke Investment Group
Elongating the time period to 10-days also suggests that this selloff is now similar to other historical declines. In fact, the current A/D ratio ranks in the bottom percentile! So, although the decline is painful, investors can take some comfort in the fact that today’s bear market is at least approaching other historical declines. Perhaps we’re considerably closer to the end of this selloff than the beginning.
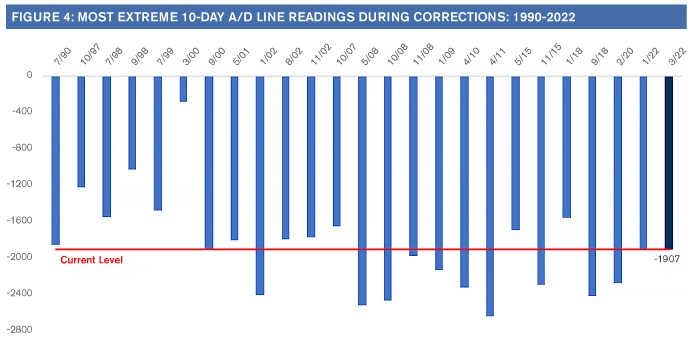
Source: Bespoke Investment Group
WHAT LAYS AHEAD?
Above, we’ve analyzed and compared what’s happened with other historic selloffs. It’s information you can use to glean a sense of what may happen in the months and quarters ahead. Here again, we can share some good news.
Let’s revisit the previous data point—currently the market’s A/D ratio is in the bottom percentile. In school, you want to be in the 99th percentile to get accepted into a great university. For investors, however, to gain outsized profits in the years ahead, its actually good to be in the 1st percentile!
According to Bespoke, “Whether you look at the following week, month, three, six, or twelve months, the S&P 500’s average forward return was better than the average for all periods since 1990, and the further out from the day of the extreme reading, the larger the degree of outperformance.” (see figure 5)
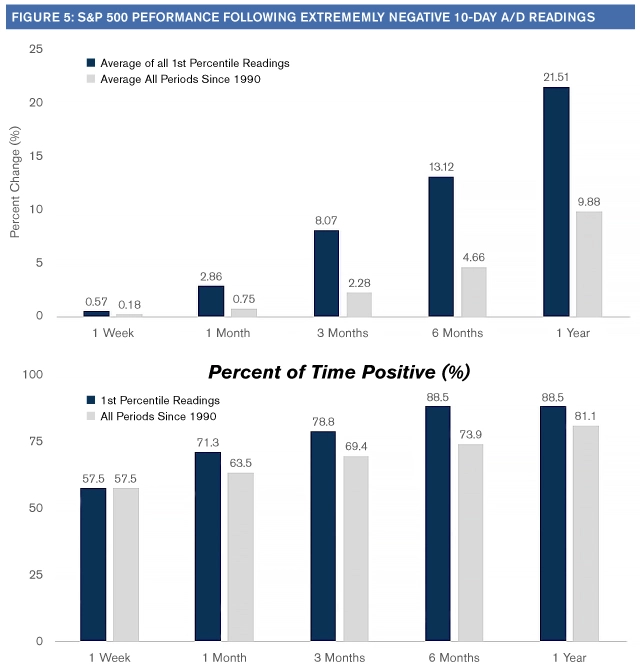
Source: Bespoke Investment Group
Certainly, anything can happen over the coming weeks and months. But if we take a longer-term view and elongate our investment time period to six and twelve months out, 88% of the time the S&P 500 was higher—with average gains of 13% and 21% respectively.
Those are pretty good stats!
While further declines are quite possible, we see the risk/reward pendulum starting to swing back in favor of the equity investor in the back half of 2022.
The information contained herein is for informational purposes only and should not be considered investment advice or a recommendation to buy, hold, or sell any types of securities. Financial markets are volatile and all types of investment vehicles, including “low-risk” strategies, involve investment risk, including the potential loss of principal. Past performance does not guarantee future results. For details on the professional designations displayed herein, including descriptions, minimum requirements, and ongoing education requirements, please visit seia.com/disclosures. Signature Estate & Investment Advisors, LLC (SEIA) is an SEC-registered investment adviser; however, such registration does not imply a certain level of skill or training and no inference to the contrary should be made. Securities offered through Royal Alliance Associates, Inc. member FINRA/SIPC. Investment advisory services offered through SEIA, 2121 Avenue of the Stars, Suite 1600, Los Angeles, CA 90067, (310) 712-2323. Royal Alliance Associates, Inc. is separately owned and other entities and/or marketing names, products, or services referenced here are independent of Royal Alliance Associates, Inc.
Third Party Site
The information being provided is strictly as a courtesy. When you link to any of the websites provided here, you are leaving this website. We make no representation as to the completeness or accuracy of information provided at these websites. Nor is the company liable for any direct or indirect technical or system issues or any consequences arising out of your access to or your use of third-party technologies, websites, information and programs made available through this website. When you access one of these websites, you are leaving our web site and assume total responsibility and risk for your use of the websites you are linking to.
Dated Material
Dated material presented here is available for historical and archival purposes only and does not represent the current market environment. Dated material should not be used to make investment decisions or be construed directly or indirectly, as an offer to buy or sell any securities mentioned. Past performance cannot guarantee future results.