Dow Jones Drops 1,031 Points!
By Deron T. McCoy, CFA®, CFP®, CAIA®, AIF®
Chief Investment Officer
That’s the ‘all caps’ headline the media might use for shock value, hoping to lure you into reading their article or clicking their ad. While this may indeed rank as the 3rd largest point decline ever[1], keep in mind that the six largest point declines have ALL occurred within the last two years. What? I thought we were in a bull market and the Dow Jones was setting all-time highs? Well, that is precisely the underlying reason. With the Dow having soared to 29,000, a drop of 1,000 points (which on the surface seems tumultuous) amounts to a -3.56% selloff.
The financial world is based on percentages, not absolute points. A 3.5% decline doesn’t even rank in the top 100 of percentage point declines[2]. Just a little more than a decade ago (back in November of 2008), a smaller 800-point decline would have represented a -10% selloff; a far more significant event than this.
Why did the Market Selloff?
Over the weekend and seemingly out of nowhere, the much-feared coronavirus moved into Europe and some parts of the Middle East, raising concerns that it might not be as easily contained as originally hoped. While the incoming data out of China is encouraging, the rate of infections in South Korea, Iran, and Italy are bothersome.
Furthermore, some investors are also keeping a watchful eye on the democratic primaries where progressive candidates are experiencing a recent surge and overtaking more moderate choices—something which seems to spook the capitalism-based stock market.
We believe that this too shall pass. But it might take some time – as investors must first digest this wave of new news. If history is any guide, after a month or two markets may stabilize and start looking to the back half of 2020 where many of today’s headwinds (namely the Boeing shutdown, the virus, and election uncertainty) will subside. Call it ‘addition by subtraction’. Furthermore, with somewhat depressed economic activity here in Q1, look for other governments to follow China’s lead in stimulating their local economies.
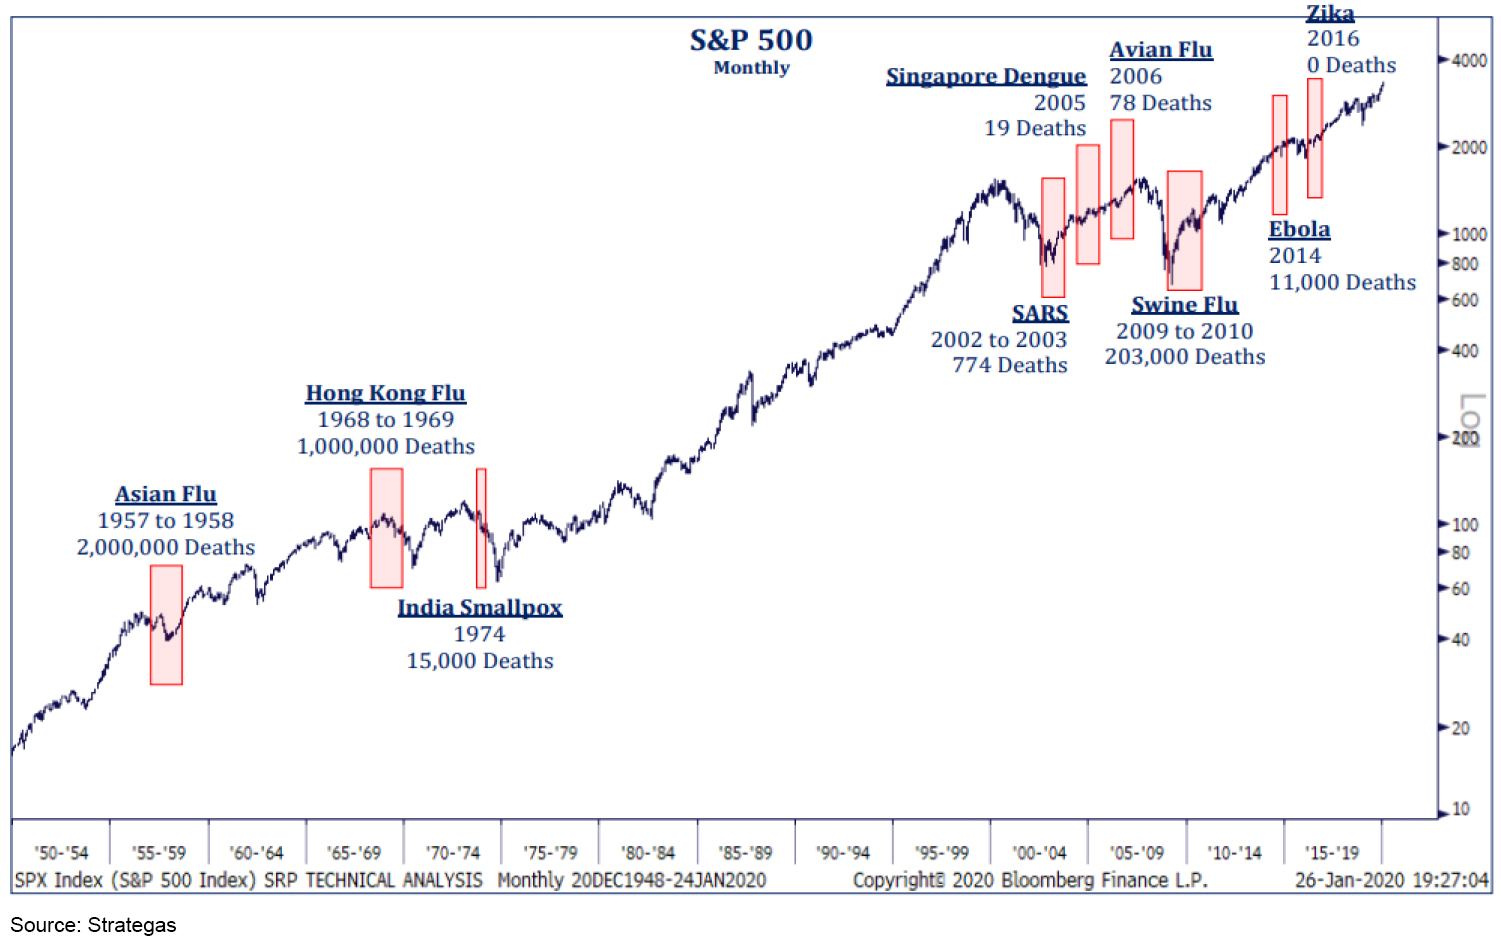
While the thought of a global pandemic is certainly frightening, it is by no means an unprecedented event. According to Strategas, there have been nine separate health scares dating back to 1950. While the human toll was tragic, longer-term effects on the economy and stock markets have proven to be minimal.
The truth is that 3% selloffs happen periodically in nearly every bull market. In fact, the Dow Jones not too long ago (in 2018) dropped 800 points—when the index was 4,000 points lower. And again, it dropped 1,175 points earlier that year when the index was 1,000 points lower. For some reason, however, many investors (and the media) tend to obsess over the immediate short-term negatives rather than looking at things in context.
Our experience shows that wise investors, on the other hand, keep market moves in perspective. While the Dow did lose 1,000+ points today, it was also up 1,500 points in the first part of February and another 1,400 points last quarter. Market corrections are not only normal but healthy – removing a level of froth that could otherwise cause a bubble. Since 1980, the average S&P 500® annual peak-to-trough decline has been around 13.8%[3] but that includes recessionary years. Even in the last 6 years of this bull market, selloffs have averaged 7.8% per year[4] – while markets continued marching to all-time highs. The current ~5% selloff, therefore, is nothing more than average and should be expected.
[1]S&P 500
[2]Wikipedia
[3]FactSet, Standard & Poor’s, J.P. Morgan Asset Management
[4]S&P 500
Investing involves risk including the potential loss of principal. No investment strategy can guarantee a profit or protect against loss. Past performance is no guarantee of future results. Please note that individual situations can vary. Therefore, the information presented here should only be relied upon when coordinated with individual professional advice. Securities offered through Royal Alliance Associates, Inc. member FINRA/SIPC. Investment advisory services offered through SEIA, LLC, 2121 Avenue of the Stars, Suite 1600, Los Angeles, CA 90067, (310) 712-2323. Royal Alliance Associates, Inc. is separately owned and other entities and/or marketing names, products or services referenced here are independent of Royal Alliance Associates, Inc.
Third Party Site
The information being provided is strictly as a courtesy. When you link to any of the websites provided here, you are leaving this website. We make no representation as to the completeness or accuracy of information provided at these websites. Nor is the company liable for any direct or indirect technical or system issues or any consequences arising out of your access to or your use of third-party technologies, websites, information and programs made available through this website. When you access one of these websites, you are leaving our web site and assume total responsibility and risk for your use of the websites you are linking to.
Dated Material
Dated material presented here is available for historical and archival purposes only and does not represent the current market environment. Dated material should not be used to make investment decisions or be construed directly or indirectly, as an offer to buy or sell any securities mentioned. Past performance cannot guarantee future results.