Intra-Quarter Update
By Deron T. McCoy, CFA®, CFP®, CAIA, AIF®
Chief Investment Officer
Sam Miller, CFA®, CAIA®
Senior Investment Strategist
Just three short months ago, U.S. Large Caps (S&P 500®) were up 7.5% for the year, peaking at a lofty 2872.1 At that time we opined that ‘it might be wise to temper enthusiasm for the S&P 500 a bit’ and urged investors ‘to expect and prepare for future volatility, revisit your investment plan and at the very least rebalance’; carefully pointing out that the large profits and little risk of the previous year (“2017: Tastes great, less filling!”) was by no means normal.
Since then, volatility has indeed increased. Compared to 2017 which saw only eight days with a +/- 1% move in the stock market, year-to-date investors have already been subject to thirty such moves.2 What’s important to note here, however, is that this is far more in line with historic norms than the previous year (See Exhibit 1). While many investors may have been lulled into complacency by the calm, steady ascent of 2017, it’s important to keep in mind that we’re now witnessing isn’t the start of something sinister, but simply a return to normalcy.
Exhibit 1: Daily Closes of 1% or more for the S&P 500
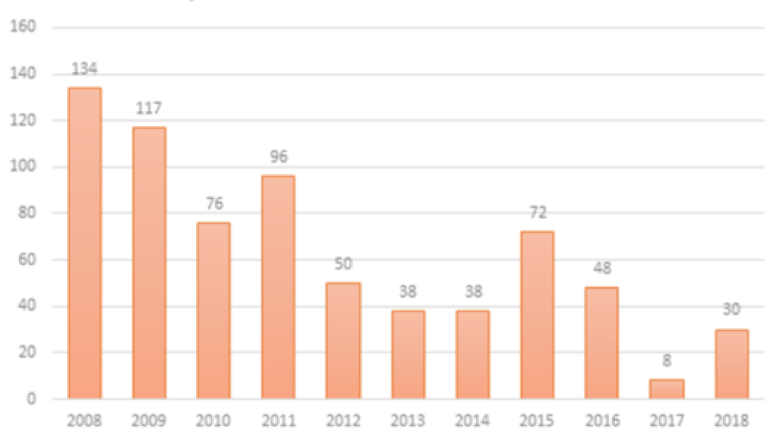
As of: April 25, 2018
Source: S&P Dow Jones Indices
Trading Pattern Extends Into Earnings Season
The increased volatility started in late January with U.S. stocks gyrating up and down in a choppy trading pattern and has continued into the beginning of Q2. The reasons for the periodic selloffs seem to vary from month to month – from February’s inflation scare to March’s tariffs and now April’s earnings season. Since every quarter corporations post their earnings for the prior three months, this quarter investors are finally getting a chance to analyze the impact of the tax cut first outlined last August and finally enacted in December.
So what’s the verdict? Simply put, earnings are great! But some investors are trying to double count. The earnings are great this quarter because of the tax cut first laid out back in August – the same tax cut that fueled much of the Q3/Q4 run-up. Perhaps Wharton School finance professor Jeremy Siegel said it best when he told CNBC, “That’s why [the market] went up at the end of 2017. That was the rally…Then, when earnings were good, people thought it should go up again in 2018. That’s double counting. [The market] had already gone up knowing that earnings would be good.”
Even after their recent bouts of volatility, however, stocks remain meaningfully higher than they were last August. And since they are forward-looking indicators (which investors drove higher late last year in anticipation of this quarter’s great earnings), the sixty-four thousand dollar question should be: What are stocks predicting for the next 6-9 months?
Market Outlook
Some investors are now concerned about a potential deceleration, and that the sugar high from the tax cuts is just that—a temporary boost rather than a sustained growth trajectory. We disagree, as virtually all economic metrics point to a sustained expansion. As such, we don’t ascribe recent weakness to recessionary fears; instead we believe it’s far more symptomatic of ‘valuation multiple’ fears.
Some investors are becoming increasingly worried about higher wages and capital expenditures (capex) reducing margins, while others are concerned about the rise in interest rates (the 10-year Treasury Bond yield finally climbed above 3% for the first time since 2011) hurting over-levered, bottom rung companies. But increased wages and increased capex should help the greater economy which will promote growth and extend this cycle. And if higher interest rates remove some of the dead wood from the economy (i.e. bankruptcies) then higher quality companies should benefit. This is what capitalism looks like. This is what a normal business cycle looks like. This is good.
So, what’s the problem? In this environment, with higher input costs (wages, capex, interest rates via borrowing), the valuations of last year may no longer be as accurate. In short, it is much more of a benign ‘in the weeds’ math problem rather than a malignant macro global recessionary problem. Perhaps investors shouldn’t pay an 18x Price/Earnings multiple for a stock but rather a more palatable 16-17x. Fortunately, that is the extent of the issue we find ourselves facing today as a result of prices having moved down while earnings moved up. If S&P 500 earnings next year are somewhere around $170, then the S&P 500 should trade towards 2700 by year end assuming a 16x valuation multiple (and towards 2890 if assuming a 17x multiple). This is by no means a prediction, but rather a formula that can be used as guidance for investors in search of a north star.
Individual Outlook
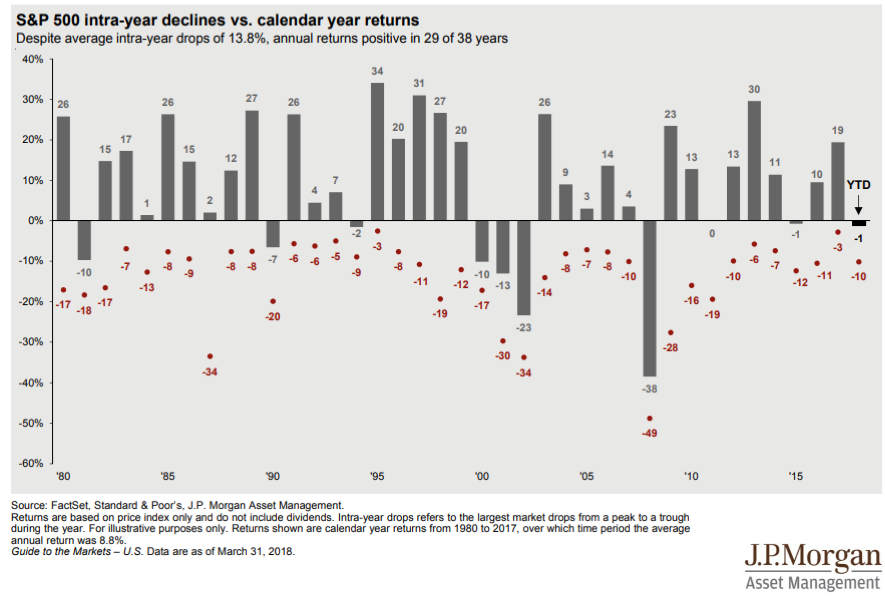
Presently, markets are concerned with the ongoing prospect of trade wars, continuing regulatory scrutiny of tech firms, and a potentially more aggressive Federal Reserve. Even though we have a relatively strong global economy with low real interest rates and earnings revisions continuing to trend upward, markets will need time to digest these new risks and may correct to the downside in the process. Reminder: the average intra-year drop of the S&P500 since 1980 has been 13.8%.3 The drawdown of 10.1% that we experienced in late January to early February is still well within the realm of reasonable expectations for investors (see adjacent chart).
The best course of action currently is to revisit your asset allocation to make sure it’s still in line with your goals and expectations, rebalancing if necessary. Continuing to hold well-diversified portfolios should help to soften any periodic bumps in the road as markets continue to normalize. Even well-diversified portfolios, however, aren’t immune from volatility. That’s why investment discipline remains essential to weathering these storms.
Source Material:
1 Source: S&P 500 intraday high on January 26, 2018
2 Source: Yahoo Finance
3 Source: FactSet, Standard & Poor’s, J.P. Morgan Asset Management
The information and descriptions contained herein:
(1) are not intended to be complete descriptions of all events but are provided solely for general informational purposes; (2) is the opinion of SEIA’s Investment Committee and is subject to change at any time. The opinion of the Committee is based on current public information that we consider reliable, but we do not represent it is accurate or complete. (3) should not be solely relied upon when making investment decision. It is important to carefully consider investment objectives, risks, charges and expenses of any investment before investing. Different types of investments involve varying degrees of risk. Principal value and investment return of stocks, mutual funds, and other investment products will fluctuate. Neither the information presented, nor any opinion expressed constitutes a recommendation of any particular security, strategy or investment product. Indices and benchmarks references herein are unmanaged and cannot be invested in directly. Index performance does not reflect the expenses associated with the management of an actual portfolio. Past performance is not indicative of future results. Registered Representative/Securities offered through Signator Investors, Inc., Member FINRA, SIPC, 2121 Avenue of the Stars, Suite 1600, Los Angeles, CA 90067. SEIA, LLC and its investment advisory services are offered independent of Signator Investors, Inc., and any subsidiaries or affiliates.
Third Party Site
The information being provided is strictly as a courtesy. When you link to any of the websites provided here, you are leaving this website. We make no representation as to the completeness or accuracy of information provided at these websites. Nor is the company liable for any direct or indirect technical or system issues or any consequences arising out of your access to or your use of third-party technologies, websites, information and programs made available through this website. When you access one of these websites, you are leaving our web site and assume total responsibility and risk for your use of the websites you are linking to.
Dated Material
Dated material presented here is available for historical and archival purposes only and does not represent the current market environment. Dated material should not be used to make investment decisions or be construed directly or indirectly, as an offer to buy or sell any securities mentioned. Past performance cannot guarantee future results.