Q3: Raging vs Aging Bull
2018 Q3 Investment Landscape
By: Deron McCoy, CFA®, CFP®, CAIA, AIF®, Chief Investment Officer
Sam Miller, CFA®, CAIA, Senior Investment Strategist
In recent weeks, financial news outlets have published dozens of articles with attention-grabbing headlines citing the “longest bull market in history.” Is this factual or the financial version of “fake news”? Let’s take a closer look.
Over the past three decades, there have been several market drawdowns that have come tantalizingly close to the official definition of a bear market – a 20%+ correction (Figure 1). While these articles exclude the 19.39% correction in 2011 and the 19.34% correction in 1998 from consideration as official bear markets, they conveniently count the 19.92% correction of 1990 as a bear market. So, apparently their definition of a bear market hinges on nothing more than a choice of rounding math.
Figure 1: S&P 500 “19%” Market Cycles
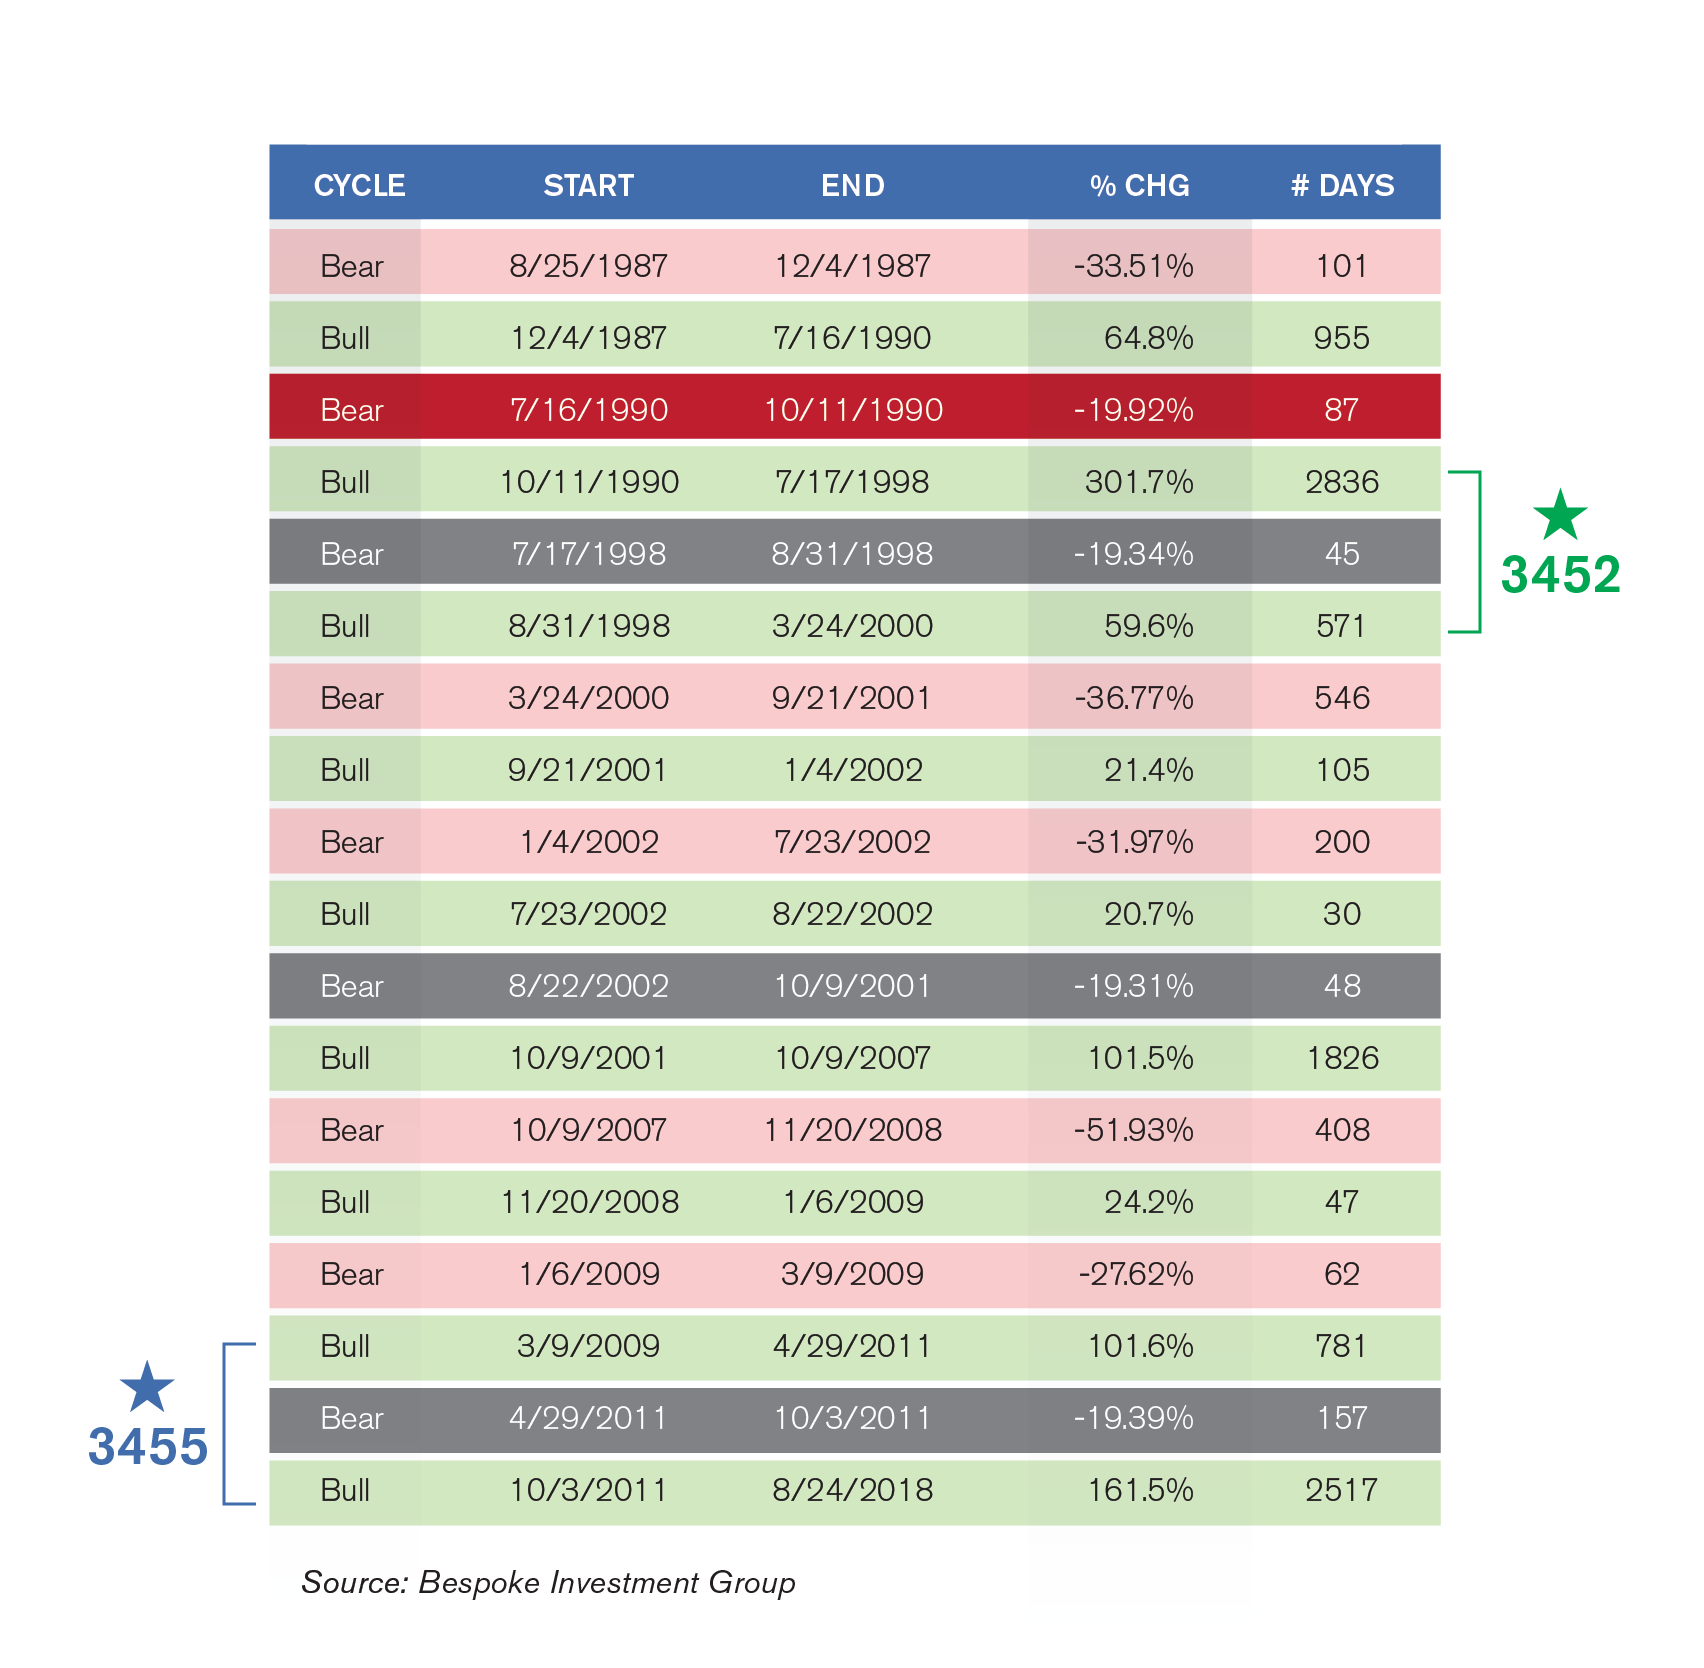
Bottom line, based on your math, the current bull market ranks 1st, 2nd, or 3rd in duration. But does it really matter?
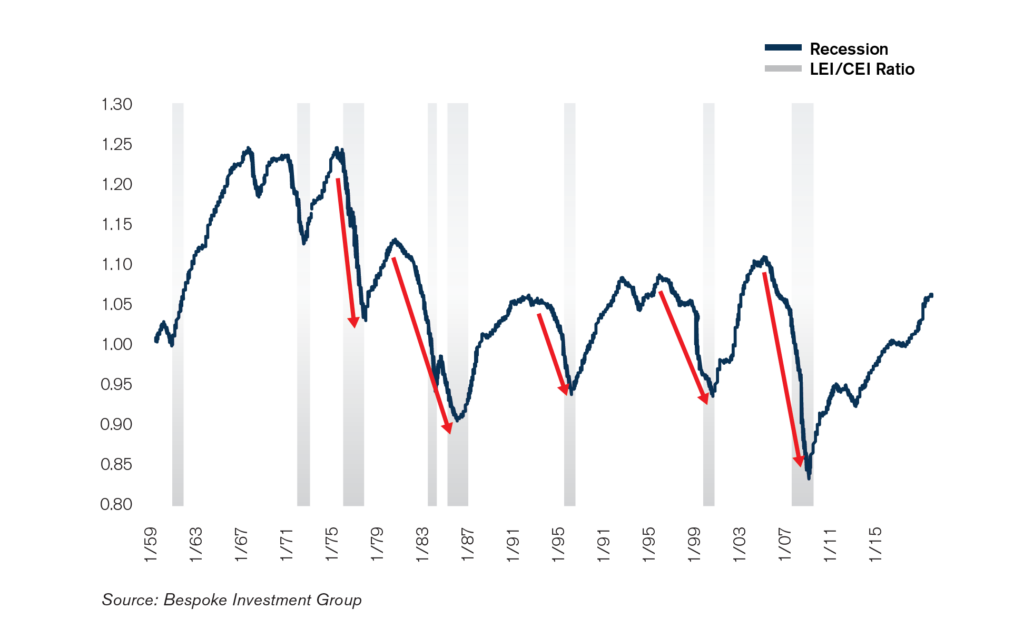
Conventional market wisdom holds that bull markets don’t die of old age. Yet the media incessantly causes investors to worry by drawing imaginary corollaries between the market environment of 2000 and 2008 and the length of the current market cycle. In reality, the economy continues to do well according to many closely watched economic indicators. For example, the leading economic index (LEI), a composite of forward-looking indicators, typically peaks and rolls over prior to a recession. It affords investors an early warning signal – and to date has given no indication of rolling over anytime soon. Additionally, we can compare leading (what will happen) to coincident (what is happening) indicators (Figure 2). This ratio on average peaks about two years ahead of recessions. By this rationale, if we’re currently peaking, a recession likely would not come until 2020.
Figure 2: Leading/Coincident Indicator Ratio Not Signalling Recession
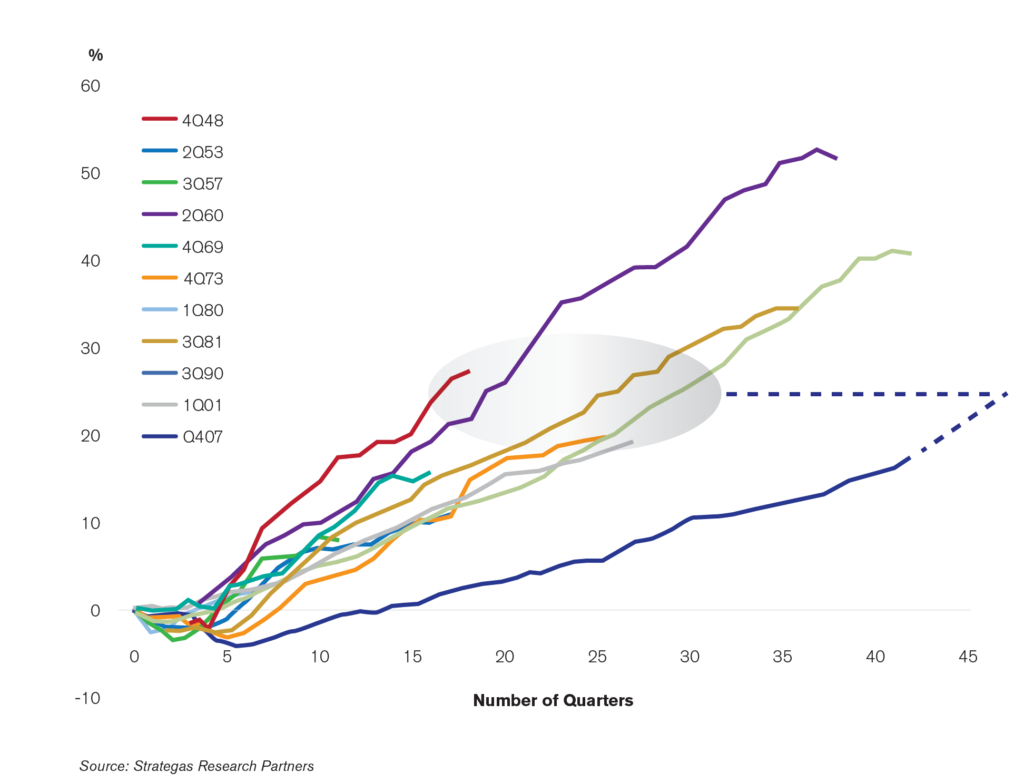
It’s the strength (not the length) of an economic cycle which can lead to overbuilding, too much capacity, and overleverage – in turn causing the economy to contract (the definition of a recession). If we compare the current cycle to previous economic expansions, we are likely looking at 1-2 more years of accelerating expansion before we even reach an average level (Figure 3). And given the depth of the financial crisis, expectations for an above-average expansion seem more than reasonable. Like a rubber band, the harder you pull, the harder it snaps back when released. We would expect the economy to snap back harder (with more economic strength) given the depth of the previous recession.
Figure 3: Strength of Economic Expansions
Cumulative Real GDP Growth Since Prior Peak %
So, let’s take a closer look at some other key economic indicators:
Payrolls: On average, only after payroll employment growth decelerates for two years does a recession typically occur. Since 1941, the average has been 27 months (Source: Bureau of Labor Statistics). Currently, there are still no signs of deceleration.
Wage growth: Wage growth is a sign of a maturing business cycle. Wage growth of 4% or higher has historically pressured profit margins. But even once wage growth accelerates to 4%, it takes another two years on average until a recession hits. We are currently nowhere close to 4% wage growth. Assuming it takes two more years to reach that number, this points to a potential recession in 2021-2022.
Yield curve: The yield curve is a line that plots interest rates of treasury bonds at different maturity dates. An inverted yield curve (when the 10-yr treasury yield falls below the 2-yr treasury yield) historically points to a recession within the next 18 months. While the curve is presently close to inversion, it’s still not there yet. Assuming it takes another 4 months for the yield curve to invert, this suggests a recession in mid-2020. Also, it’s important to note that when the yield curve drops below 75 bps, stocks typically do quite well. With that in mind, there appears no reason to run for the hills. The median historic return for the S&P 500® over the subsequent 6-month to 1-year period is 11-15% (Source: Bespoke Investment Group).
Consumer confidence: Consumer confidence is also an important metric to monitor, since consumer spending makes up roughly 80% of our economy. Consumer confidence typically plummets approximately one year before a recession. At the moment, there is no sign of a drop. In fact, confidence just hit a new 18-year high on August 28th.
Manufacturing: Manufacturing is highly sensitive and levered to the business cycle. A peak in manufacturing activity typically leads to recession three years down the road. If manufacturing peaked now, it would point to a recession sometime in 2021.
According to all these indicators, recession appears to be nowhere in sight. As noted in our previous publications, the data points to a continuation of the current bull market. And while it is certainly an aging bull, age doesn’t mean it’s over by any stretch of the imagination. The tea leaves suggest we still have a couple years before a recession, so we suggest sticking with your plan and remaining fully invested.
Information provided reflects the firm’s views as of the date of this presentation. Such views are subject to change at any time without notice. Signature Estate & Investment Advisors, LLC (SEIA) has obtained the information provided herein from third party sources believed to be reliable, but no representation is made as to their completeness or accuracy. We are not responsible for the consequences of any decisions or actions taken as a result of information provided in this presentation and do not warrant or guarantee the accuracy or completeness of the information provided. Performance data quoted represents past performance. Past performance does not guarantee future results. Investment return and value of shares will fluctuate. There is a risk of loss from an investment in securities, including the risk of loss of principal. Different types of investments involve varying degrees of risk, and there can be no assurance that any specific investment will be profitable or suitable for a particular client’s financial situation or risk tolerance. Asset allocation and portfolio diversification cannot assure or guarantee better performance and cannot eliminate the risk of investment losses. Accordingly, you should not rely solely on the information contained in these materials in making any investment decision. For a copy of our current form ADV Part 2 that includes a description SEIA’s services provided, fees charged and other important information, please call us at 310-712-2323 or visit www.seia.com.
Third Party Site
The information being provided is strictly as a courtesy. When you link to any of the websites provided here, you are leaving this website. We make no representation as to the completeness or accuracy of information provided at these websites. Nor is the company liable for any direct or indirect technical or system issues or any consequences arising out of your access to or your use of third-party technologies, websites, information and programs made available through this website. When you access one of these websites, you are leaving our web site and assume total responsibility and risk for your use of the websites you are linking to.
Dated Material
Dated material presented here is available for historical and archival purposes only and does not represent the current market environment. Dated material should not be used to make investment decisions or be construed directly or indirectly, as an offer to buy or sell any securities mentioned. Past performance cannot guarantee future results.