Russia Invades Ukraine
By Deron T. McCoy, CFA®, CFP®, CAIA®
Chief Investment Officer
This article was originally published on Thursday, February 24, 2022, with the S&P 500 trading at 4166.
It wasn’t that long ago that markets were trading at all-time highs; with the S&P 500® hitting an intraday high of 4818 on January 4th. But stocks sold off over the ensuing 16 trading days, pushing the S&P 500 down 11%, and (according to Bloomberg) marking the worst start to a year—ever!
Now, with the Russian-Ukraine conflict escalating, stocks have an additional source of fuel for their ongoing volatility.
As expected, global capital markets are reacting negatively to these events. Significant intra-year declines, however, are hardly unusual. According to JPMorgan, since 1980 intra-year declines have averaged -14%. Yet despite this volatility, the gains have far outpaced the losses; resulting in an average annual return of +9.4%. Stocks go up, stocks go down—it’s what they do. Volatility is simply the price we as investors must pay to reap outsized returns.
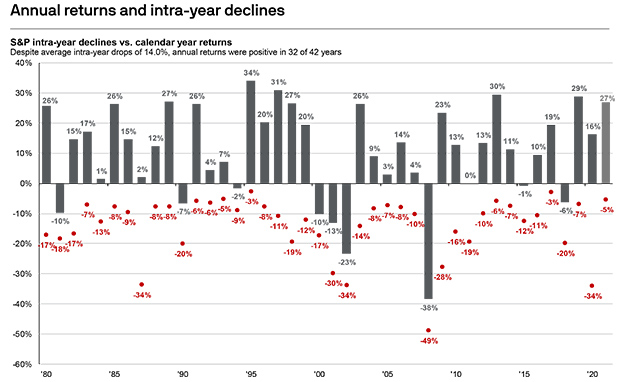
Source: FactSet, Standard & Poor’s, J.P. Morgan Asset Management. Returns are based on price index only and do not include dividends. Intra-year drops refer to the largest market drops from a peak to a trough during the year. For illustrative purposes only. Returns shown are calendar year returns from 1980 to 2021, over which time period the average annual return was 9.4%. Guide to the Markets – U.S. Data as of December 31, 2021.
But surely war in Europe changes things, right?
Not necessarily. While stocks around the globe will certainly react to the new climate in Eastern Europe, according to SSGA Research, market turbulence around geopolitical events has typically been a solid buying opportunity. While the performance of equities can be choppy in the near term, stocks have averaged an 8.8% gain over the ensuing year—and if one excludes the Oil Embargo outlier from 1973—stocks have recouped their losses within a quarter or so.
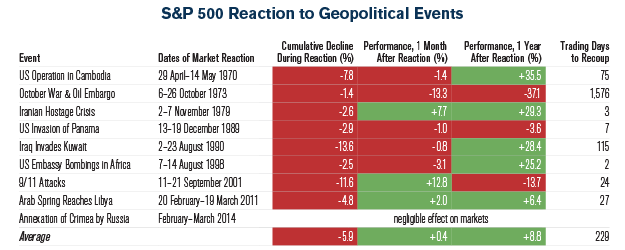
Source: SSGA Research, Bloomberg. Past performance is not a guarantee of future results.
So where could markets ultimately bottom? Let’s analyze this from several angles…
- Average Intra-Year Drawdown: A -14% drawdown from the January highs would move the S&P 500 towards 4130.
- Average Geopolitical Drawdown: Assuming the Russian aggression started negatively affecting markets on February 2nd (the date the United States sent 3000 troops to fortify NATO forces), a -5.9% decline would move the S&P south towards 4330.
- Average Valuation Multiples from Pre-Pandemic: We have previously discussed how the current higher inflationary/higher interest rate investment climate implies lower valuations (prices) for stocks. If markets do revert to the valuation multiples of the 2018-2019 pre-pandemic time period, then the S&P could trade towards 4050 now or 4230 by year-end.
- Average of the Averages: Taking an average of the above puts the S&P somewhere in the vicinity of 4175.
On February 24th, Russia, as feared, did invade deep into Ukraine, and stocks responded by moving lower into the 4130-4150 area, right in line with the average-of-averages outlined above. If history serves as a guide, stock declines may be closer to the end than the beginning.
The adjacent chart from FundStrat further highlights the idea that geopolitics don’t play a permanent role in stock prices. And Scott Minerd from Guggenheim seemingly agrees. “As history demonstrates, the beginning of war often leads to short-term market volatility but quickly provides phenomenal buying opportunities. Look to use current market dislocations to add to risk position in select credit securities and cheap stocks.”
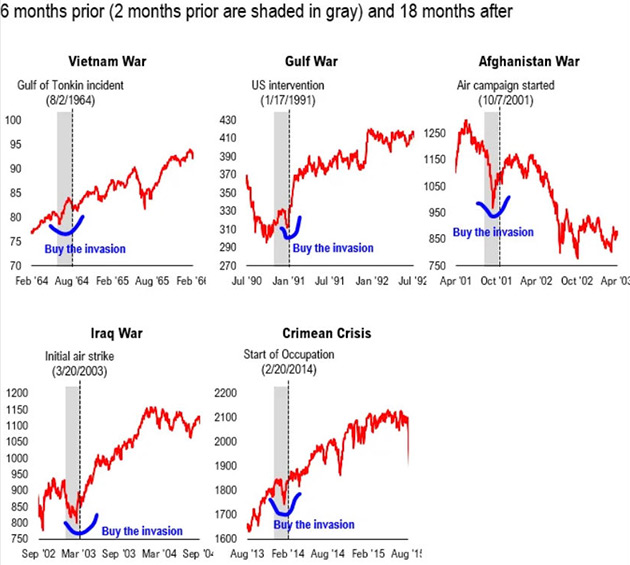
Source: Fundstrat, Bloomberg
Although markets can certainly go lower, it’s important to remember that real long-term wealth is often generated in these times of stress. Intestinal fortitude and a good financial plan can help ensure that you don’t sell (or are forced to sell) at or near the bottom; but instead have the means to take advantage of volatility—seeking out select opportunities in the weeks and months ahead.
The information contained herein is for informational purposes only and should not be considered investment advice or a recommendation to buy, hold, or sell any types of securities. Financial markets are volatile and all types of investment vehicles, including “low-risk” strategies involve investment risk, including the potential loss of principal. Past performance does not guarantee future results. There is no guarantee that a diversified portfolio will outperform a non-diversified portfolio in any given market environment; it is a method used to help manage investment risk. Indexes cannot be invested in directly, are unmanaged, and do not incur management fees, costs, and expenses. For details on the professional designations displayed herein, including descriptions, minimum requirements, and ongoing education requirements, please visit seia.com/disclosures.
Signature Estate & Investment Advisors, LLC (SEIA) is an SEC-registered investment adviser; however, such registration does not imply a certain level of skill or training and no inference to the contrary should be made. Securities offered through Royal Alliance Associates, Inc. member FINRA/SIPC. Investment advisory services offered through SEIA, 2121 Avenue of the Stars, Suite 1600, Los Angeles, CA 90067, (310) 712-2323. Royal Alliance Associates, Inc. is separately owned and other entities and/or marketing names, products, or services referenced here are independent of Royal Alliance Associates, Inc.
Third Party Site
The information being provided is strictly as a courtesy. When you link to any of the websites provided here, you are leaving this website. We make no representation as to the completeness or accuracy of information provided at these websites. Nor is the company liable for any direct or indirect technical or system issues or any consequences arising out of your access to or your use of third-party technologies, websites, information and programs made available through this website. When you access one of these websites, you are leaving our web site and assume total responsibility and risk for your use of the websites you are linking to.
Dated Material
Dated material presented here is available for historical and archival purposes only and does not represent the current market environment. Dated material should not be used to make investment decisions or be construed directly or indirectly, as an offer to buy or sell any securities mentioned. Past performance cannot guarantee future results.