The Ever-Changing Investment Landscape
By Deron T. McCoy, CFA®, CFP®, CAIA®
Chief Investment Officer
If you’ve been following us for a while, you’ll recall a quote from Sir Isaac Newton (or perhaps Alexander Hamilton) which we occasionally refer to: “Every action has an equal and opposite reaction.” While it may seem like a bit of a disconnect to apply the laws of physics to finance, there’s clear evidence that the investment landscapes of one era often have echo effects that impact the next. Look no further than recent events:
-
- The landscape of the pandemic in 2020 saw the U.S. throwing massive amounts of stimulus money at the problem – on a scale that had no historic precedent;
- This in turn beget the frothy ‘over-caffeinated’ investment environment of 2021;
- Which in turn led to the 2022 landscape – with 40+ year highs in inflation causing tighter monetary policy via one of the fastest hiking cycles in modern history;
- All of which equated to the largest rise in 10-year Treasury Bond yields since before Alexander Hamilton was issuing those same Treasuries in 1788!; and
- That rapid rise in interest rates steadily pushed bond prices lower – which now brings us to 2023…three bank failures in one week including the second and third largest FDIC-covered bank failures in U.S. history.
Wait, are you saying that the global pandemic caused a bank failure in Silicon Valley?
Well yeah, kind of. When the pandemic hit, Washington DC (both Congress and The Federal Reserve) flooded the system with liquidity (cash). Economists don’t like the term cash and instead prefer to use the more sophisticated term known as ‘M2 Money Supply.’ In the adjacent chart, you can clearly see the sharp spike upwards during 2020. And while this stimulus of cash certainly helped a great many individuals and companies make it through the lockdown, it also had repercussions (as it always does).
| M2 Money Supply |
|---|

Shaded areas indicate U.S. recessions.
Source: Federal Reserve Bank of St. Louis. Time period displayed: 1/1/95 – 10/31/21.
All that stimulus money had to be placed somewhere. And the most natural landing spot was the banking system itself – as witnessed by the flood of deposits flowing into FDIC-insured banks.
| 1-Year Growth in Deposits at FDIC-Insured Banks (through 2021) |
|---|

Source: FDIC. Data is as of December 31, 2022.
When banks take in deposits, they typically loan the money right back out. Essentially, that’s the banking business model—borrow short (via nearly free deposits) and lend long at significantly higher interest rates. But according to the FDIC and Eddie Duzlak, CIO of Virtuent, “Typically, deposits and loans have historically tracked each other quite closely. The lines in the chart below are almost indistinguishable through 2008, after which they diverge. At the risk of oversimplifying, loan demand in the U.S. weakened after the 2008 crisis, and banks increased securities portfolios as a result. This growth in securities portfolios saw another acceleration in 2020 and 2021, as deposit growth spiked.” The statement ‘growth in securities portfolios’ is important as it immediately preceded the inflationary period of 2022.
| Deposits and Total Loans & Leases |
|---|
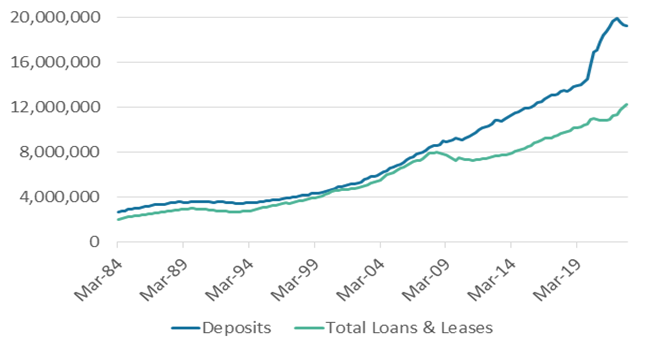
Source: FDIC. Values are in millions of USD. Data is as of December 31, 2022.
To combat the inflation problem, the Fed tightened monetary policy through a rapid series of short-term interest rate hikes (450 basis points in less than a year). And as interest rates rose, bond prices declined. Who wants to buy an older bond paying 1% when you could get a new one paying 4%? Any potential buyer certainly wouldn’t pay you par for the bond – they’d only purchase it at a steep discount. Thus bond prices went south as yields went north.
This has resulted in banks carrying unrealized losses on the massive ‘securities portfolio’ that they had just purchased a few years prior. And again, according to Mr. Duzlak, “these unrealized losses are unprecedented in a historical context, driven by 1) the increased share that securities portfolios make up as a percent of banks’ assets and 2) the rise in interest rates being so rapid relative to history in response to U.S. inflation.”
Which all leads us to 2023. With short-term interest rates poised to reach 5%, depositors suddenly realized that they could get higher yields elsewhere and started moving money en masse away from low interest bearing checking and savings accounts – completely reversing the huge growth in deposits from a year ago; leaving banks scrambling to unwind all of those previous purchases and turning unrealized losses into realized losses.
| 1-Year Growth in Deposits at FDIC-Insured Banks (through 2023) |
|---|

Source: FDIC. Data is as of December 31, 2022.
Silicon Valley Bank was one of the first bank failures due to their unique situation (close ties to Private Equity, their founders, and large amounts of uninsured deposits) which only served to exacerbate the problem. But the underlying problem remains relevant for all banks. According to Mr. Duzlak, “it would be shocking if we are not talking about loan-level delinquencies, charge-offs and credit losses later this year. This is the slower-moving risk in banks that has been dormant for many years now thanks in part to easy monetary policy, and it seems to be awakening due to the knock-on effects of higher interest rates and the draining of liquidity from the financial system.”
The 2023 landscape isn’t favorable for Regional Banks or Financials in general – a fact which was evident back in 2022—and the reason why our model portfolios sold the financial sector a year ago and steadily reduced our bank exposure as 2022 progressed. In bond portfolios, we wanted to reduce exposure as well—which is why we also sold Bank Preferreds Stocks last year too.
Because of these banking woes, many are now fearful of a material economic slowdown that may push interest rates back down as investors clamor for the safety of bonds (as of this writing, the two-year Treasury Bond yield has already dropped a full percentage point). Fortunately, however, this too was predicted earlier and our model portfolios added exposure to longer fixed-rate bonds in an attempt to not only lock-in higher yields but also benefit from price appreciation should interest rates drop (highlighted in our Q1 webinar discussing alternative ‘safe bridges’).
While we’re not right 100% of the time, rather than ‘reacting’ (which is what most investors do), SEIA continually strives to position portfolios ahead of time – seeking to avoid (in this instance Financials) or benefit (buying Bonds) from upcoming changes in the investment landscape.
We are honored that you entrust us with your hard-earned cash. And rest assured that our custodians (unlike your banks) are indeed paying you a fair amount on all that cash. To restate our January commentary, we continue to be on recession watch and shall adjust appropriately if these problems in the banking sector begin to bleed into the greater economy – all while keeping an eye towards 2024 and the next change in the investment landscape.
The information contained herein is for informational purposes only and should not be considered investment advice or a recommendation to buy, hold, or sell any types of securities. Financial markets are volatile and all types of investment vehicles, including “low-risk” strategies, involve investment risk, including the potential loss of principal. Past performance does not guarantee future results. For details on the professional designations displayed herein, including descriptions, minimum requirements, and ongoing education requirements, please visit seia.com/disclosures. Signature Estate & Investment Advisors, LLC (SEIA) is an SEC-registered investment adviser; however, such registration does not imply a certain level of skill or training and no inference to the contrary should be made. Securities offered through Royal Alliance Associates, Inc. member FINRA/SIPC. Investment advisory services offered through SEIA, 2121 Avenue of the Stars, Suite 1600, Los Angeles, CA 90067, (310) 712-2323. Royal Alliance Associates, Inc. is separately owned and other entities and/or marketing names, products, or services referenced here are independent of Royal Alliance Associates, Inc.
Third Party Site
The information being provided is strictly as a courtesy. When you link to any of the websites provided here, you are leaving this website. We make no representation as to the completeness or accuracy of information provided at these websites. Nor is the company liable for any direct or indirect technical or system issues or any consequences arising out of your access to or your use of third-party technologies, websites, information and programs made available through this website. When you access one of these websites, you are leaving our web site and assume total responsibility and risk for your use of the websites you are linking to.
Dated Material
Dated material presented here is available for historical and archival purposes only and does not represent the current market environment. Dated material should not be used to make investment decisions or be construed directly or indirectly, as an offer to buy or sell any securities mentioned. Past performance cannot guarantee future results.